Creating the app Planeatary for a sustainable and healthy diet in everyday life
Planeatary is a mobile app designing to support users to follow a healthy and environmentally friendly diet.
UX Design
FrontEnd Development
Mobile


The User Insights Knowledge Base project tackles the challenges of limited user contact and knowledge sharing at Digitec GmbH. By using a Design Sprint-inspired workshop approach and creating a centralized database, my colleagues and I established a concept for data-driven decision-making and collaboration across departments. I was the project lead, but was supported by colleagues from the product team and the companyʼs other UX designer.
August 2021 ➙ June 2023
In the rapidly evolving landscape of user experience, understanding users and their needs is crucial for driving product success. Digitec, a B2B software company operating in a niche market, faced unique challenges due to limited user interaction and a lack of accessible user knowledge across departments. To overcome these obstacles, the User Insights Knowledge Base project was undertaken, aiming to establish a centralized repository of user insights and foster collaboration among teams. This article presents a detailed case study that highlights the projectʼs approach, including a workshop-inspired Design Sprint, the implementation using Atlassian Jira, and continuous improvement through testing and iteration. By delving into the projectʼs objectives, methodology, and outcomes, this article showcases the value of a user-centered approach in driving informed decision-making and promoting cross-functional collaboration within an organization.
»A knowledge base is a self-serve online library of information about a product, service, department, or topic.«
Our goal of creating the User Insights Knowledge Base was to solve several problems we had (especially as the Product Management team). As a b2b company with a software in a niche area, Digitec has a few specific problems connected to the fact that we only have a handful of users per customer. This also limits the contact to the users and before the introduction of the User Insights Knowledge Base, many employees did not have sufficient knowledge about users. This has resulted in two primary problems:
We decided to do a workshop to create a general concept for the User Insights Knowledge Base. There were several reasons, why we did a workshop and not just worked out a concept by ourselves:
The workshop was strongly inspired by Design Sprints and was done with 6 participants: 2 persons from Product Management, 2 UX Designers, 1 person from the Support team and 1 person from Sales. I planned and moderated the workshop together with a colleague.

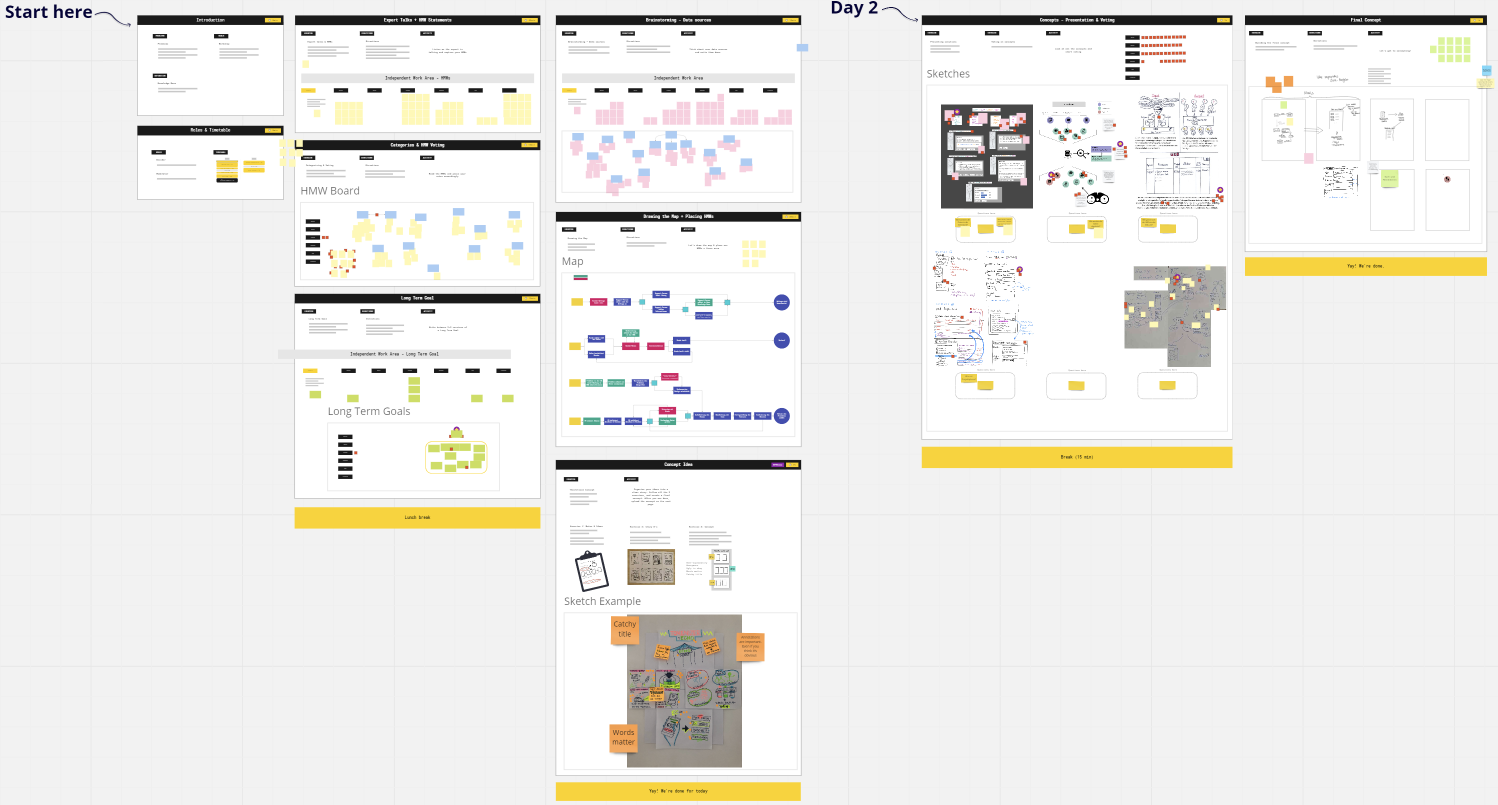
Screenshot of the workshop timetable in Miro: on the first day the Empathize phase took place, including different exercises, and was followed by the Ideate phase on the second day. I will describe both phases in detail below.
After a little intro including the current problems we saw in the company as well as a definition of the term Knowledge Base and telling the participants about the workshops goals, we started with a mix of the Empathize and Define phase of Design Thinking, which are all about understanding the problem and building up empathy with the user (which in this case was us as users from different departments).
We first did Expert Talks where we interviewed a person from Product Management and another one from Support about their daily work and their requirements. While listening to the interviews the participants wrote down notes as How Might We Statements - short statements starting with “How might we“ like “How might we make visible where problems for users exist?“. We then read through all the notes and grouped them with headings like “Quantifying problems“, “Workflow of the teams“ or “Benefits of the User Insights Knowledge Base“.
The next task was to define a Long Term Goal for the User Insights Knowledge Base. For this every participant wrote down 3 goals imagining a ideal world in 2 years. Then we voted for one goal, which was:
»In 2 years, an optimal knowledge transfer among the departments is provided by the User Knowledge Base.«
Our next task isnʼt a part of a usual Design Sprint. It was a short brainstorming session where everyone wrote down all the possible data or touchpoints with customers that could go into the knowledge base, like events, support requests, software demos, training sessions, log files, user analytics, surveys etc.
Afterwards we did User Journey Maps. In this case we ourselves are the users of the User Insights Knowledge Base, so we created a map with 4 different users: Support, Sales, UX and Product Management and brainstormed about their goals and mapped their workflow. Then we marked steps where either data could go into the User Insights Knowledge Base or the insights in it would be helpful for our work.
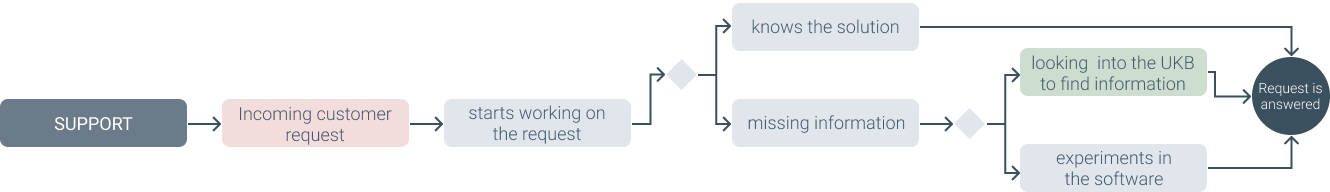
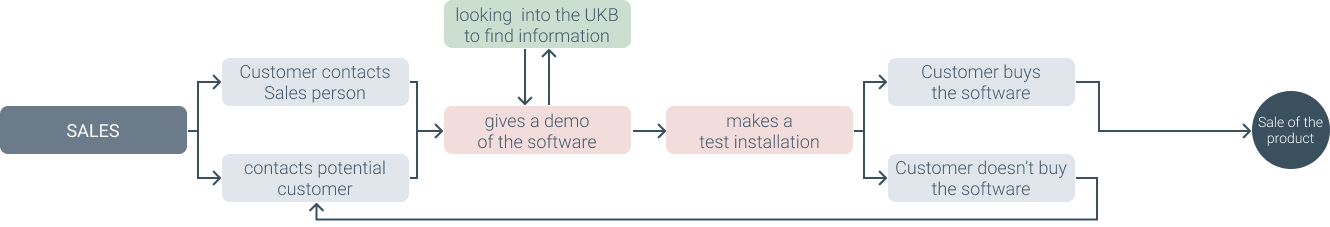

The resulting user journey maps from the workshop. Red rectanges: data comes into the User Insights Knowledge Base, green rectanges: data from the User Insights Knowledge Base is used. “UKB” is an abbreviation for User Insights Knowledge Base.
Since ideation is better done alone - because group dynamics can lead to having worse solutions - all the participants got the “home work“ to come up with a solution.
In the second part of the workshop we came together to discuss the solutions by the participants and come up with a final solution. Every workshop participant got 10 minutes to present their concept to the other participants and to answer questions. Afterwards we did a Dot Voting on the different solutions and parts of it. And finally we took the parts we liked and put them into a final solution, that I will present below.
Screenshot of the Miro-Board that was used in the workshop
After creating the concept, we implemented it using Atlassian Jira. Now it was time to test the concept. For this we set up a weekly "UKB Inbox"-Meeting (UKB is our abbreviation for User Insights Knowledge Base), where we went through data together to get a feeling for the process and work with our concept. After a few months we then did a Retrospective to get feedback from all the colleagues working with the User Insights Knowledge Base and continuously improved it. A few improvements we did over time:
The general concept of the User Insights Knowledge Base is to take as much raw data, which is data from interactions or touchpoints with users — like protocols from user interviews, analytics data or emails from users — into the database and then derive more valuable data from it, like user insights, Personas or an Opportunity Solution Tree (which I will explain further below).
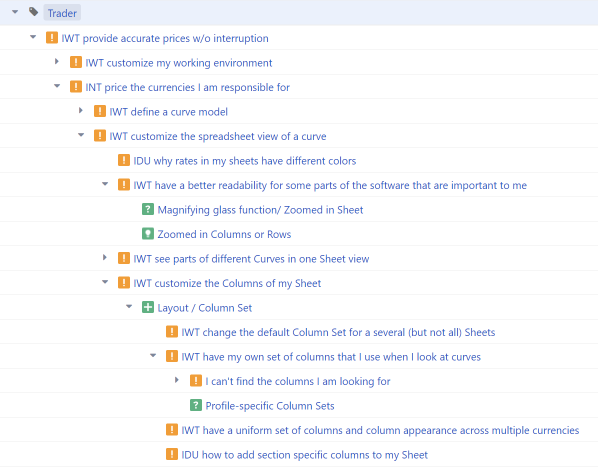
Additionally, the User Insights Knowledge Base is kept searchable through keywords for every data point, links to other related data points and other important tags, like for our software the “User-Roles”. Since we have a b2b product family in the foreign exchange market, a user role for us would for example be “FX Trader” or “Trade Support”.

In her book “Continuous Discovery” Teresa Torres describes a technique to continuously discover the unmet customer needs and the solutions that will address those needs. She also invented a form to visualize Continuous discovery: The Opportunity Solution Tree. The goal of the tree is to address customer opportunities that will have the biggest impact on the company’s outcome.
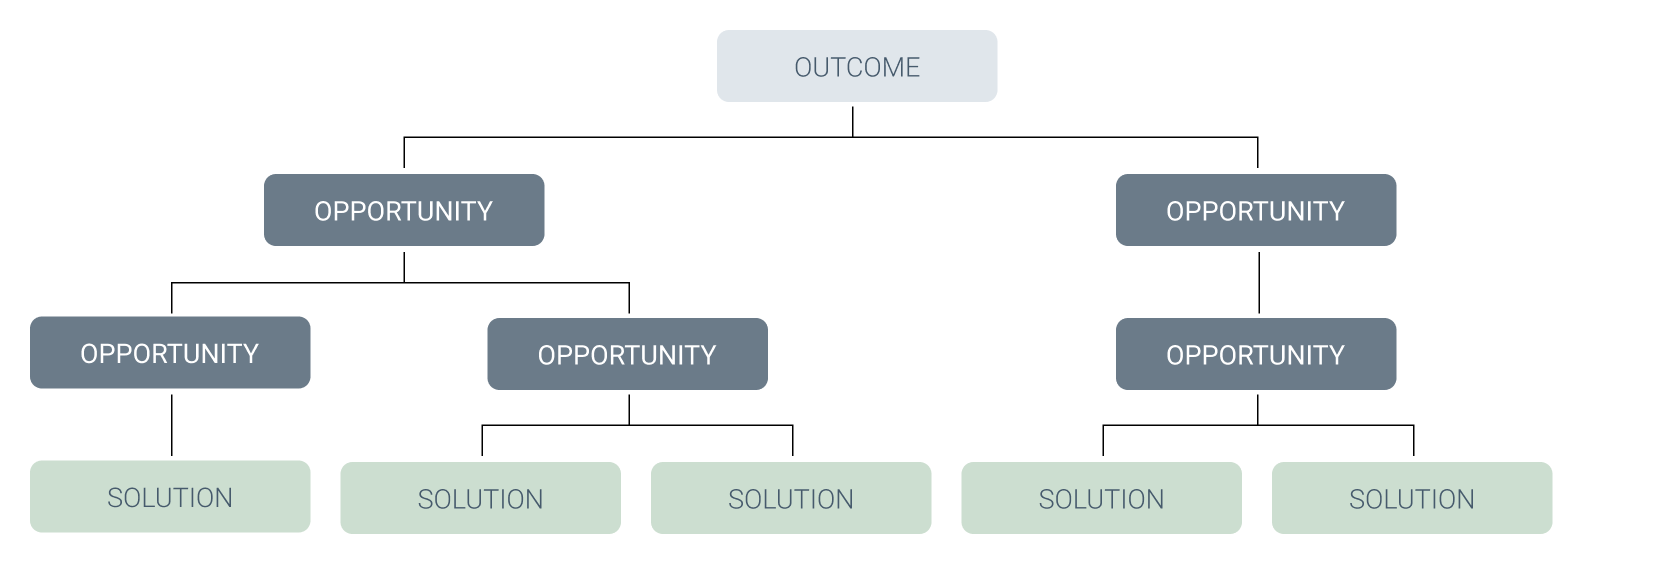
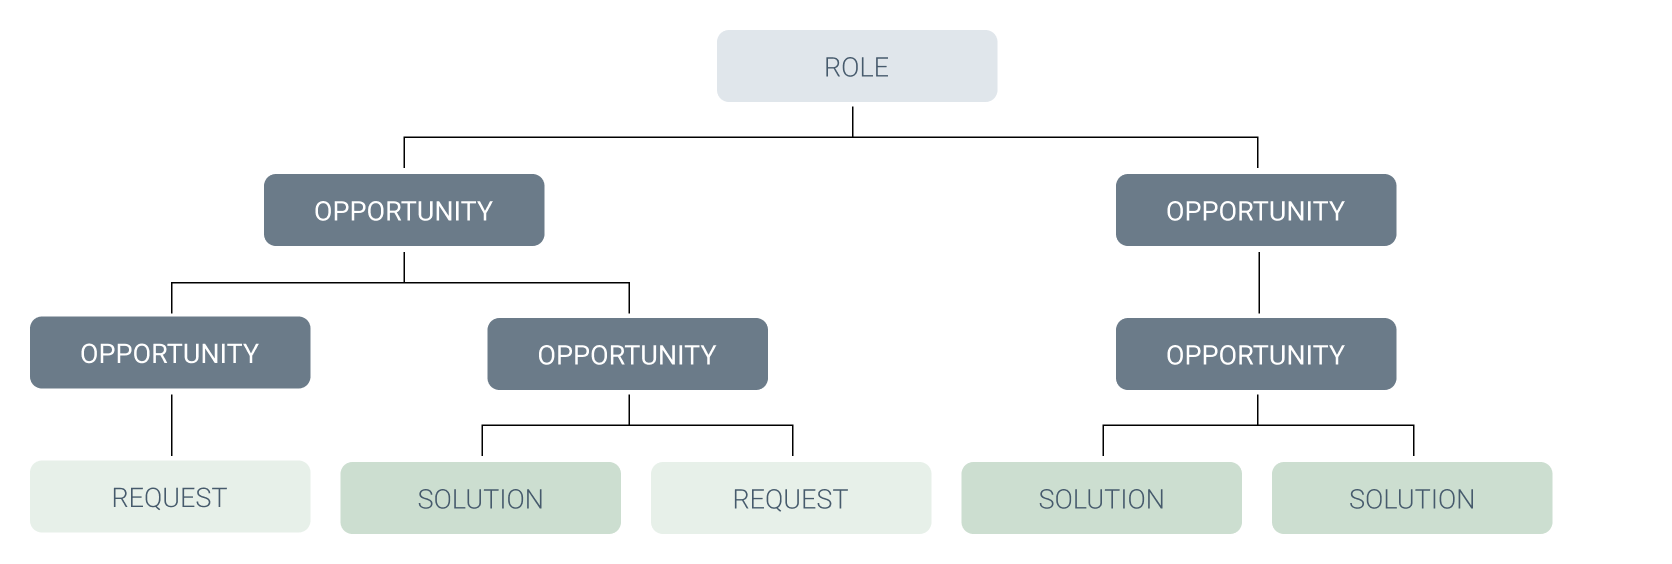
On the first level are Outcomes, these are business outcomes that describe the business needs of the company. Below it are Opportunities on as many levels as needed, therefore one Opportunity can be the child of another opportunity and so forth. On the lowest levels are Solutions. We adapted the Opportunity Solution Tree as the main outcome of and as a structure for our User Insights Knowledge Base. For that we switched the Outcomes to our User Roles, which now form the head of the tree. Additionally, we included (Customer-) Requests on the same levels as the Solutions, since both describe possible solutions to an opportunity.
The Opportunity Solution Tree enables the team to make data driven decisions and to empathize with the user. In our case our main Opportunity Solution Tree (for the role of the FX Trader) has nearly 1000 data points and many layers of opportunities. But it’s important to note that the lowest layer is always the layer of requests and solutions, while the top layer is a single role.
Before we dive into how this actually looks like in practical use, I want to dive a little deeper into the different data points we use in the User Insights Knowledge Base:
Since Jira is a tool that is already adopted and widely used in the company, we also implemented the User Insights Knowledge Base with Jira. In principle, however, the basic concept presented here can also be implemented in many other tools.
Each data type (Opportunity, Insight, …) is represented by a custom Jira Issue Type. For Raw Data, we have also created the data types relevant for us as issue types, currently these are protocols and emails, whereby we summarize different types of “data generation” in protocols, for example, we write protocols for user interviews, demos with customers or support sessions.
The different tickets are then linked to each other by custom links — whereby the link type also represents the relationship between the tickets and is later used to generate the Opportunity Solution Tree.

The “arises from” and “is cause of” link is used to establish the connection between Raw Data and Derived Data. In addition, it is also used to express whether a raw data point is for or against a Solution (Request or Solution) (“arises from” vs “is opposed by”).
Opportunities are linked to each other with a parent-child relationship. Insights can also be linked to Opportunities using the same link. Additionally, Solutions and Requests are linked to Opportunities using the link “tries to solve”/ “might be solved by”.
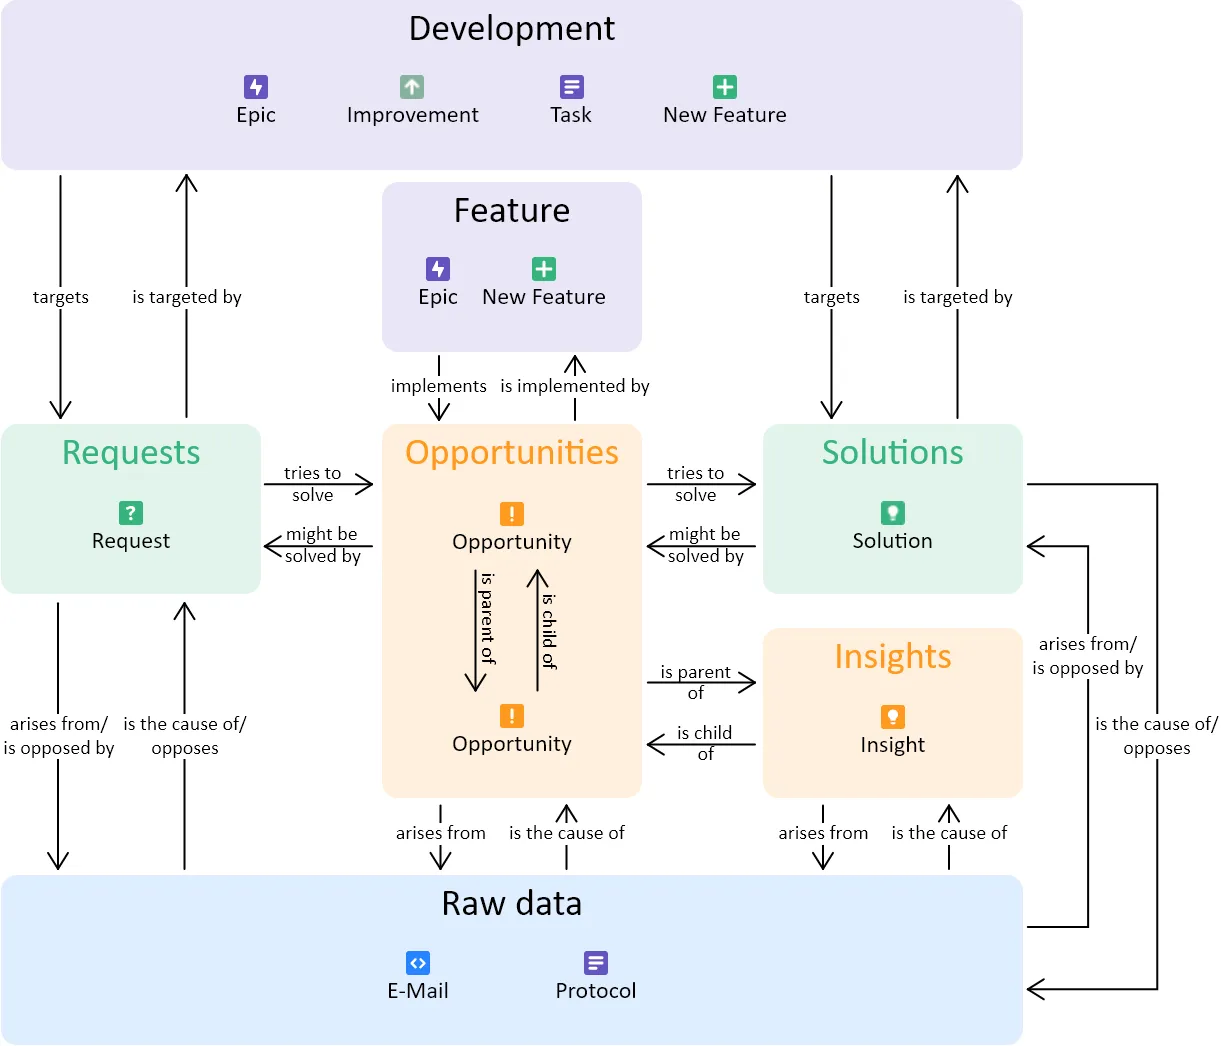
Additionally, there are links to the development tickets (a ticket type that already existed before the creation of the User Insights Knowledge Base, which are used and edited by developers, product owners, etc.). The resulting relationships make it possible for software development team to easily access the user insights knowledge base, for example, to understand why a particular feature is built and what user problem it solves. Importantly, only Solutions and Requests can be linked directly to development tickets, forcing a process in which multiple solutions to an Opportunity are first found and considered before a final decision is made on a Solution.
Another development ticket type that is directly integrated into the Opportunity Solution Tree is the feature ticket. This is represented in the tree as a child of an Opportunity and can itself have children (Opportunities, Solutions and Requests). This should make it easier to identify user problems that are specifically related to a feature of the software.
A Jira ticket (= data point) has different fields that are filled either manually or automatically.
As manual fields, all data types have the mandatory “title” as well as keywords.

Automatically generated fields are available for the derived data types (Opportunity, Request, Insight and Solution). They go through the links and display the following data:
These metrics can also be used in search and can for example contribute to prioritization.
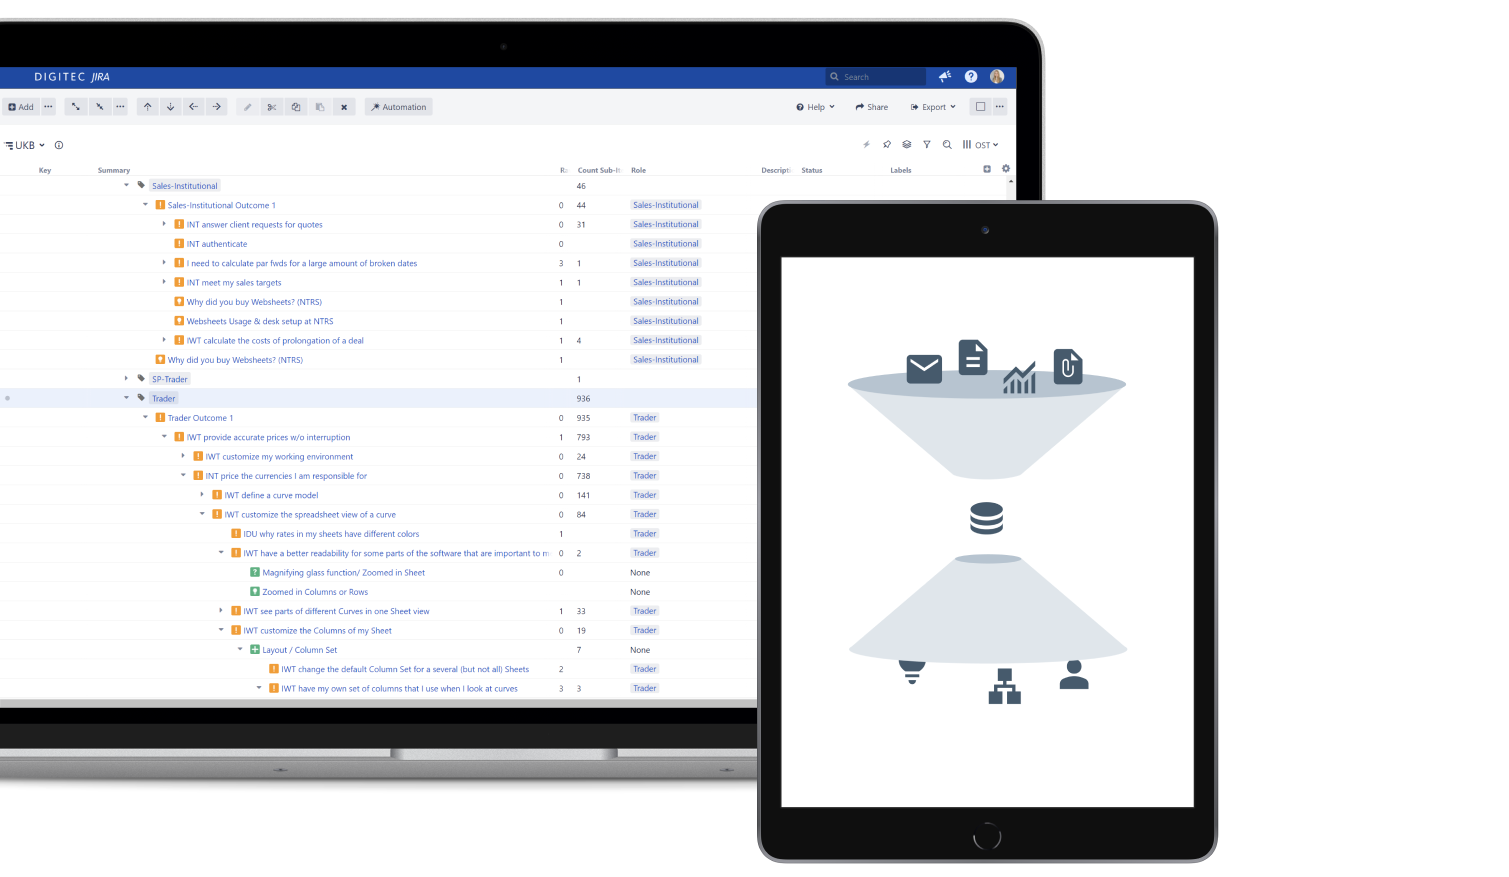
The Opportunity Solution Tree can be automatically generated in Jira using the Structure feature and the links between the tickets.
To create the structure, the Automation feature was used, whereby tickets are grouped by role and then ordered by the links (“is parent of”, “is implemented by” and “might be solved by”). The parent nodes can each be expanded until the lowest level is reached.
All the raw data tickets first go into the “Inbox” there they wait to be looked at — by a single person or our weekly User Insights Knowledge Base meeting, where we derive data together. Once that is done, they go to “Done”.
Requests and Solutions have the states “Inbox” (= we need to talk about this Request/ Solution), “Todo” (= somebody is working on it and the decision if this is to be implemented is still open) and “Done” (= a decision has been made and the solution will now be handed to further specify it for development).
The workflow of Opportunities is a little more complicated and shows our general product discovery workflow:


Planeatary is a mobile app designing to support users to follow a healthy and environmentally friendly diet.
The User Insights Knowledge Base project tackles the challenges of limited user contact and knowledge sharing at Digitec GmbH.
Get in touch for opportunities or just to say hi!